System landscapes rarely come documented – but with C1.5 you can map one in an afternoon
You’ve just stepped into a new role – maybe as CTO, maybe as Head of Development – and as usual, the
architecture is a maze or even completely missing. Documentation is outdated, knowledge is scattered, and no one holds
the full picture. Without a map, you’re flying blind.
You could spend weeks reading thru confluence, readme and code, piecing things together, but there’s a shortcut:
In this post, I’ll show you how to map a “good-enough” system landscape in one afternoon using a lightweight, practical
shortcut of the C4 framework I call C1.5.
Why Mapping Matters
If you don’t have a map of the system, you’re flying blind.
Misaligned priorities
Teams optimize locally, but nobody’s optimizing globally.
Blind spots
Hidden dependencies lurk until they break in production.
Firefighting mode
You’re reacting instead of leading.
On the flip side, even a rough system map creates instant leverage:
Alignment
Engineering, product, and leadership can finally point at the same picture.
Decision-making
You can weigh trade-offs with more confidence.
Leadership presence
A simple diagram signals clarity and control.
C1.5 – A Practical Shortcut
The C4 Model for software architecture describes four levels of diagrams from System Context to
Code.
On day one, you don’t need full container diagrams, let alone components or code. What you do need is:
a System Landscape showing all major systems, who owns them, and how they connect (slightly broader than a single
C1 diagram), and
a few lightweight Context sketches for the most critical systems.
That’s somewhere between C1 and C2 – not as detailed as containers, but more than just one context. I jokingly
call this
C1.5: the sweet spot for gaining clarity fast.
Here’s the simple, four-step process I use to map it:
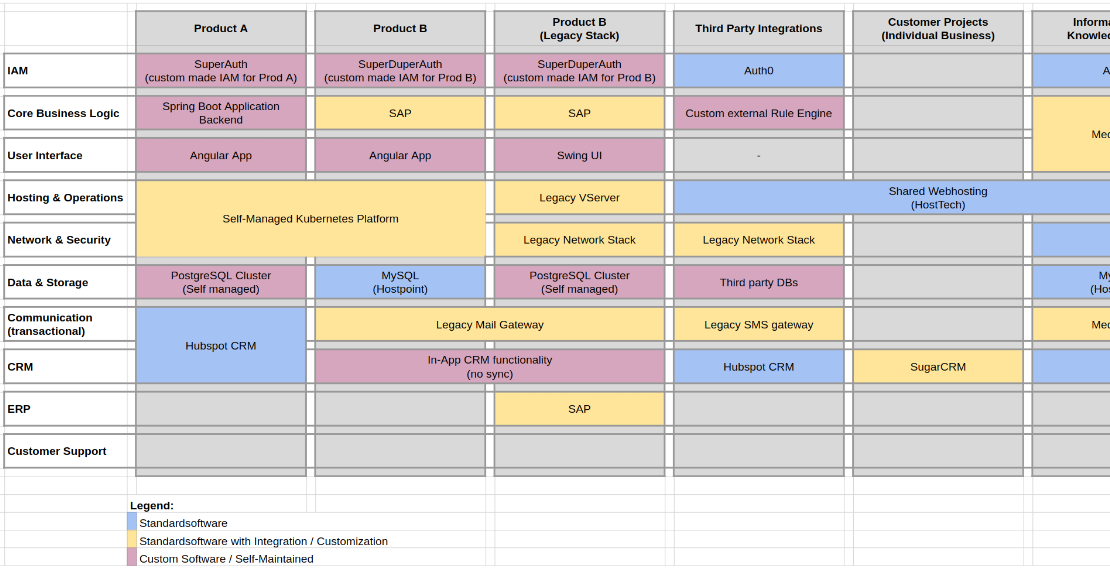
Step 1: Sketch the Landscape
Start broad. Put all the company’s systems and external dependencies on paper.
Rule of thumb: each team = one system.
If a team has none → add a “?” placeholder.
If a team has multiple → mark it and dig deeper later.
This gives you an immediate sense of ownership, coverage, and gaps.
Start simple: Map the main actors and systems, begin with what you know
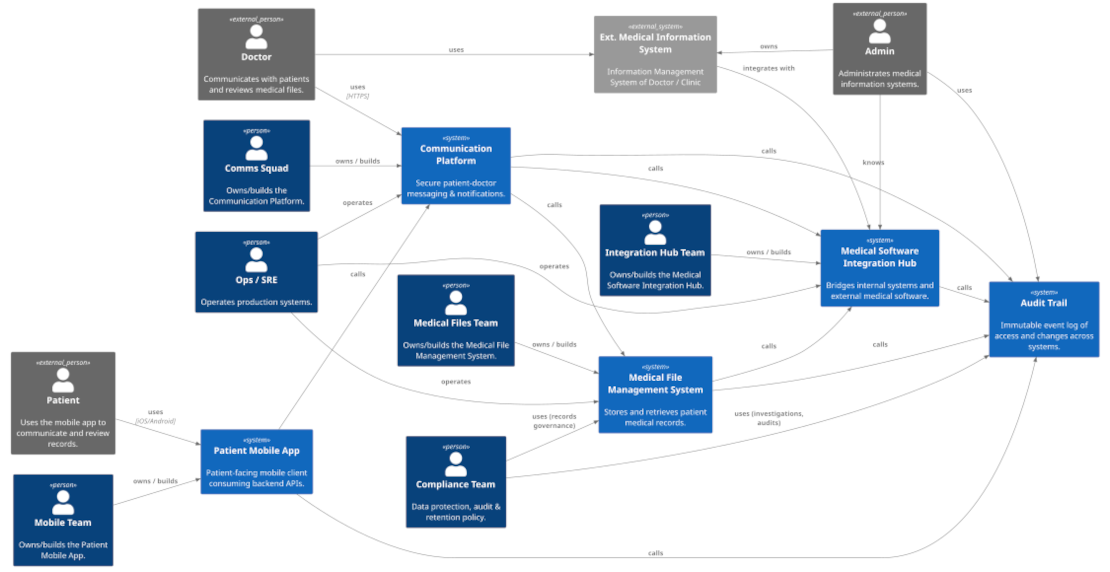
Step 2: Refine with Key Players
Grab time with product, ops, and development leads. Show them the landscape and update it live as they talk.
Ask about critical systems, pain points, and dependencies.
Cross-check assumptions across different perspectives.
Add the people or teams you talk to as actors, and connect them to systems.
You won’t get to everyone in an afternoon, but even a few voices will sharpen the picture.
Refine and add: Map main actors and systems you get during the key-player interviews
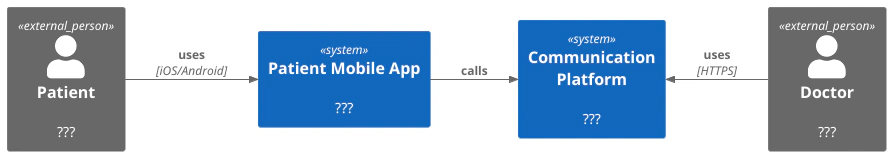
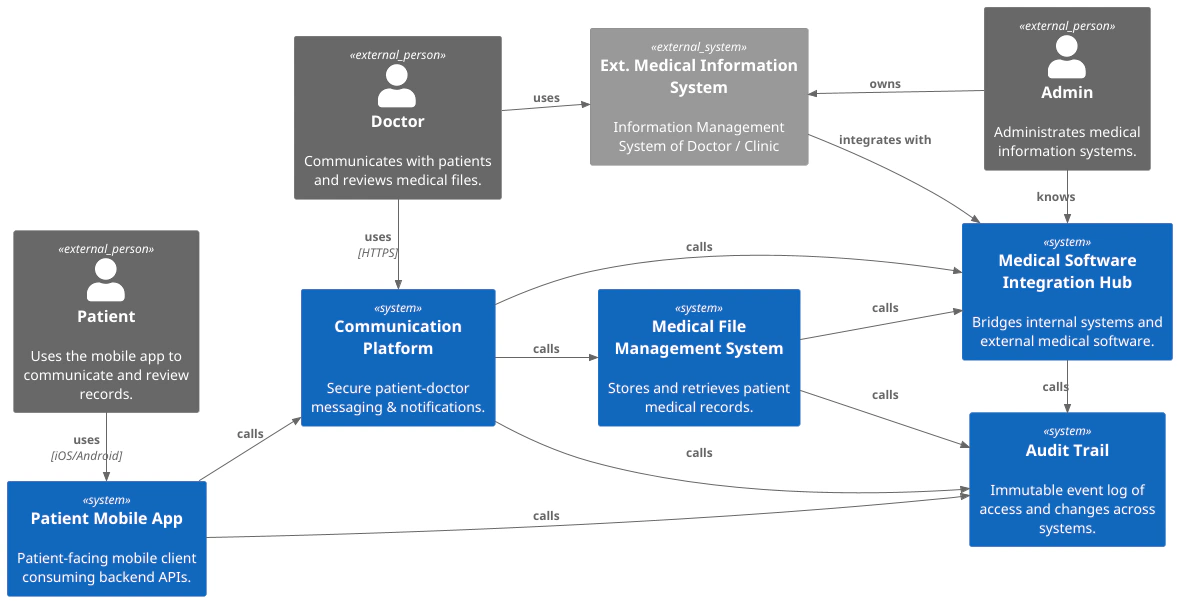
Step 3: Trace the Critical Paths
With PMs/POs, zoom into their most important user journeys.
Draft System Context diagrams just for these critical paths.
Show the actors, the system in question, and its immediate neighbors.
Ignore edge cases – focus on what delivers value day to day.
This ties the technical landscape directly to business outcomes.
Step 4: Capture Relations
As you go, capture the different ways people and systems connect. Examples I often use:
Relation
Meaning
Example
Owns
Accountable for the system
Payments squad owns the Payment Service
Builds
Develops or extends it
Backend team builds the Order Service
Operates
Runs or supports it
Ops team operates the Monitoring stack
Uses
Interacts with it
Sales uses the CRM
Calls
One service calling another’s API
Order Service calls the Payment API
You don’t need every relation on day one. Just map what’s known, possible, and useful. Different orgs emphasize
different relations – adapt to the processes you find.
Choosing the Right Tools
Tools matter, but don’t overcomplicate it. On day one, the best choice is always the tool you already know — you won’t
master a new diagramming framework in an afternoon. Whether that’s a whiteboard, Miro, PowerPoint, or Structurizr, stick
to what you can use fluently and without friction.
Equally important is accessibility. The map has little value if it’s hidden behind licenses or niche skills. Everyone in
the company should be able to open it, comment on it, and understand it at a glance.
Once the initial map has buy-in and becomes part of the team’s workflow, that’s the right time to consider moving it
into a proper C4 model with something like Structurizr or PlantUML. Models scale, enforce consistency, and let you
generate multiple diagrams from a single source of truth — but only after the organization is ready to use and maintain
them.
👉 Rule of thumb: speed and accessibility first, structured models later.
I have personally used PlantUML with
C4-PlantUML, Structurizr and
Draw.io (on Confluence). Depending on the company, existing tools, current
documentation & assets, as well as team and architecture maturity, they address different pain-points and provide
different strengths. However, evaluation of the perfect architecture modelling tool for your organization isn’t simple
and takes a lot of knowledge, time and effort.
What About EA Teams and Tools?
Depending on the scale and maturity of the organization, you may already find people or even whole teams doing parts of
this work. Larger companies often have enterprise architects, application catalogs, or service registries.
That’s valuable, and it can be a great input to your own map. But don’t confuse it with what you need on day one.
EA catalogs are often exhaustive, governance-driven, and hard to digest. Your first priority is clarity: a lightweight
system landscape that reflects how people actually work with the systems today. The act of sketching and refining the
map together is as important as the artifact itself.
So yes – many CTOs have people and tools for that and much more. If you do, use them. But still go through the
exercise
yourself, because it builds shared understanding, exposes gaps, and earns trust fast.
Final Thoughts
As a new leader, the first map you draw is first and foremost for yourself. You need to understand the landscape well
enough to make decisions, see dependencies, and ask the right questions.
The map doesn’t need to be perfect — it needs to be useful. By sketching a lightweight “C1.5” view, you create a common
picture that others can validate, challenge, and refine. That shared understanding quickly becomes more valuable than
the
diagram itself: it helps teams align, exposes blind spots, and connects product priorities to technical reality.
Speed helps, but the real point is clarity. And clarity is what lets you lead with confidence from day one.
I see myself as a curious problem solver. On a life-long mission to enable people, improve tools and optimize processes, I build software to make things work. Moreover, I like to talk about technology and sharing know-how in a team to improve my own …
The “Build it right the first time” mantra has sunk more startups than bad code ever did.
I’ve seen it firsthand: One developer built his own message broker in PHP because ActiveMQ “didn’t fit his needs.”
Another rebuilt Ansible in Perl to provision VMs. And the wildest one? Someone started designing a version control
system on top of Elasticsearch because Git was “inefficient.”
These weren’t feats of brilliance. They were ego-driven distractions that added fragility, wasted money, and created
zero customer value. And they all happened because leadership failed to ask the only question that matters:
“How does this help the user?”
In enterprise & solution architecture, connecting boxes with arrows is an often used and overrated visualization
from high-level, thru component architecture, down to data and class diagrams. However, to create a holistic view on
systems, component diagrams are not enough! When it comes to analysis or transformation of a high-level application- or
service-architecture, I prefer to draw an Application Landscape Diagram, which I would like to show and elaborate
on in this post.


 Frank Neff